DMAR released their May report last week to much “fanfare” because home inventory levels increased by 76% from May 2021 as there were 3,652 properties for sale as of May 31st in our 11-county area. Still, there are only 0.67 months of inventory for sale.However, before Covid, there were 8,891 properties for sale in May 2019 and 6,437 properties for sale in May 2018 using DMAR stats. Thus, the number of properties for sale is still down a whopping 59% from 3 years ago and down 43% from 2018. This means inventory needs to double before appreciation drops below 10%. Before Covid, numbers like this would have us shaking our heads in disbelief at how HOT our Real Estate market is. But, the last 2 years have warped our mindset and our stats and numbers.
Important Stats to Consider:
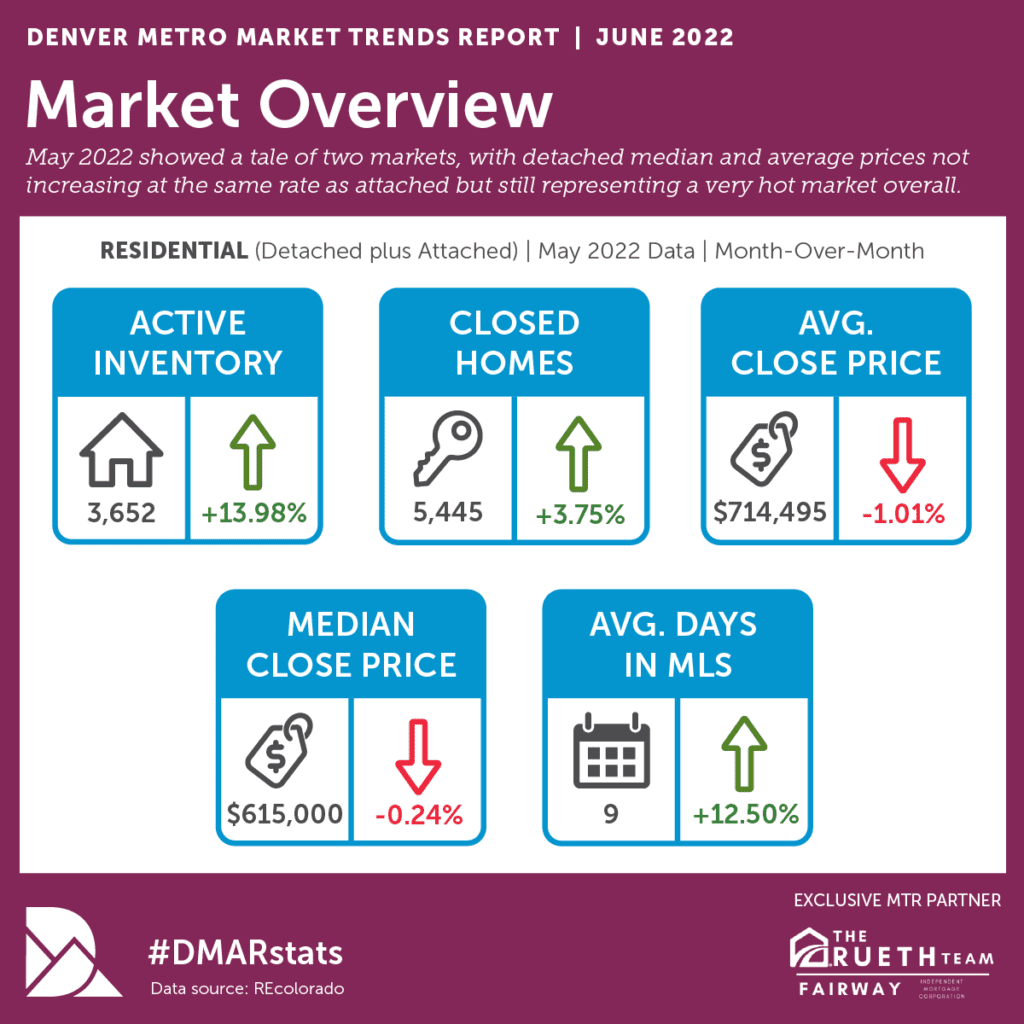
After consecutive months of appreciation, negotiations, and bidding wars, modest numbers this month became a sign that the market has returned to a semblance of ‘normal.’ The housing market ended May with 3,652 properties on the market, representing an increase of 448 properties from the previous month, which is seasonally on-trend. Closed sales increased 3.75 percent from the previous month, keeping supply and demand relatively balanced.
The attached and detached markets had a similar balance of supply and demand in May. Both markets had the highest number of standing inventory in the $500,000 to $749,999 price points. The biggest difference was the proportion of inventory. For attached properties, that price range made up 29.87 percent of the market and for detached properties, it made up 41.72 percent of the market. There are over four times more single-family detached properties between $500,000 and $749,999 than attached properties.
Throughout the entire market, year-to-date, the market has seen 7.18 percent fewer homes closed than the previous year. Even with fewer purchases, the market has transacted over $1 billion more in sales volume than the previous year, indicating how high prices have soared from the previous year. This is also indicated in the close-price-to-list-price ratio of105.33 percent, down from the previous month.
Our monthly report also includes statistics and analyses in its supplemental “Luxury Market Report” (properties sold for $1 million or greater), “Signature Market Report” (properties sold between $750,000 and $999,999), “Premier Market Report” (properties sold between $500,000 and $749,999), and “Classic Market” (properties sold between $300,000 and $499,999).
Luxury Market:
In the Luxury Market, buyers saw their options increase in May. Like the other price segments, inventory went up 5.86 percent from April and a significant 65.95 percent higher than the same month last year. Pending sales were also up, along with closed sales and sales volume as well. More choices turned into more pending sales, up 22.20 percent month-over-month and up 27.37 percent year-to-date.
Detached homes sold for an average of 107.12 percent of the list price, down slightly from April’s 108.39 percent but up 2.81 percent from the same month last year. Meanwhile, the attached condo and townhome Luxury Market is currently the softest of all price ranges and home types, selling at 104.94 percent of the list price.
The attached Luxury Market has the largest months of inventory of all price ranges at 1.73, still a seller’s market but not as strong as other areas. Overall, luxury closings were up month-over-month and up even more year-to-date with detached closings up 36.10 percent and attached homes up 10.92 percent.
Our experienced and dedicated team of real estate professionals is here to help you understand any aspect of real estate and help you through any transaction. Call us today! 303-858-8003
Read the Full June 2022 Market Update Now
Infographic